Original Link: https://www.anandtech.com/show/2948
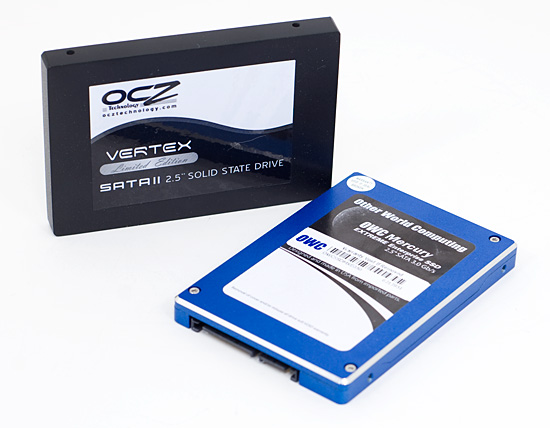
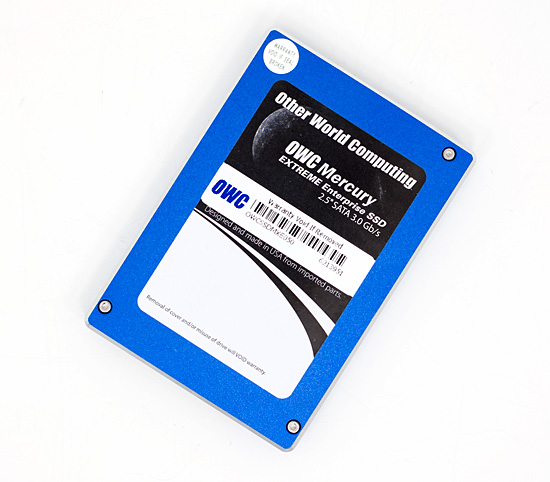
OWC Mercury Extreme SSD - First Look at a 50GB SandForce Drive
by Anand Lal Shimpi on February 26, 2010 12:00 AM EST- Posted in
- Storage
Update: Since the publication of this review OWC appears to have switched controllers for the Mercury Extreme SSD. The current specs look similar to that of SandForce's SF-1200 controller, not the SF-1500 used in the earlier drives. Performance and long term reliability (in an enterprise environment) are both impacted. For more information, read this.
I must admit, I owe OWC an apology. In my Vertex LE review I assumed that because my review sample had an older version of SandForce’s firmware on it that the company was a step behind OCZ in bringing SandForce drives to market. I was very wrong.
For those of you who aren’t Mac users, Other World Computing (OWC) just shouldn’t be on your radar. The only reason I’ve heard of them is because of my Mac experience. That’s all about to change as they are technically the first company to sell SandForce based SSDs. That’s right, OWC even beat OCZ to the punch. The first customers actually got drives the day my Vertex LE review went live. Multiple days before the LE actually went on sale at Newegg.
I mentioned it briefly in my Vertex LE review. The OWC Mercury Extreme SSD is based on the same SandForce controller as the Vertex LE. There was some confusion as to exactly what this controller is. As of today there is only a single SandForce MLC SSD controller shipping. It’s somewhere in between the performance of an SF-1200 and a SF-1500. Ultimately we’ll see the SF-1500 move to high end enterprise drives only, with the SF-1200 used in consumer drives like the OCZ Vertex 2 and Agility 2. The accompanying firmware is also somewhere in between the SF-1200 and SF-1500 in terms of performance (more on SandForce's controllers here). But as I just mentioned, its the equivalent of what OCZ is shipping in the Vertex LE.
OWC has assured me that all drives that are being sold have the latest RC1 firmware from SandForce, just like the Vertex LE. The firmware revision number alone should let you know that like the Vertex LE, these are wholly unproven drives. OWC is only sending out drives on 30 day evaluation periods, so I don’t expect many long term reliability tests to be done on those drives in particular. Thankfully we do still have the Vertex LEs to hammer on.
I previewed the Mercury Extreme in my last article, stating that it performs identically to the Vertex LE. Not only does it perform the same, but it's also a little cheaper:
| Capacity | OCZ | OWC |
| 50GB | N/A | $229.99 |
| 100GB | $429.00 | $399.99 |
| 200GB | $929.99 | $779.99 |
OWC is the first company to offer a 50GB drive based on the SandForce controller. I’d long heard rumors that performance was significantly lower on the 50GB drive, but I had no way of testing it. OCZ still doesn’t have any 50GB drives. OWC gave me the opportunity to answer that question.
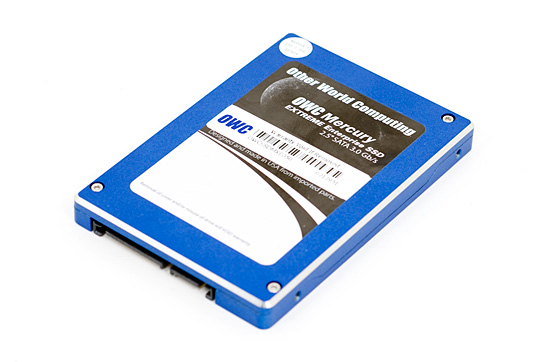
OWC got upset with me when I took their drive apart last time, so I can't provide you guys with internal shots of this drive. The concern was that opening the drive left it in an unsellable condition. I would hope that no company is reselling review samples, but you never know.
The 50GB Mercury Extreme carries a $229 price tag, that’s comparable to other small-capacity SSDs on the market:
| SSD | Price | Price per GB of NAND |
| Corsair P64 64GB | $209.00 | $3.266 |
| Intel X25-M G2 80GB | $219.99 | $2.750 |
| Kingston SSDNow V Series 64GB | $139.99 | $2.187 |
| OWC Mercury Extreme 50GB | $229.99 | $3.594 |
Unfortunately it does give you the worst cost per GB of NAND, and even worse when you consider how much of that is usable accessible. Remember that these SF-1500 controllers are derivatives of SandForce’s enterprise SSD efforts, meaning they are designed to use a lot of spare area.
Despite having 64GB of MLC NAND on board, the 50GB drive has a formatted capacity of 46.4GB. Nearly all of the extra flash is used for bad block allocation and spare area to keep performance high.
I installed Windows 7, drivers and PCMark Vantage on my 50GB drive which left me with 30.8GB of free space. That’s actually not too bad if you aren’t going to put a whole lot more on the drive. There’s more than enough room for a few applications, but think twice before using it for media storage.
Preview Today, More Tests Coming
It’s sheer excitement that made me push this review out today. I was really curious to see how well one of these 50GB SandForce drives performed. I have seen some of you request that you’d like to see more non-I/O specific, real world tests in our suite. I’ve done this in previous articles but stopped simply because the data didn’t seem to provide much value. These drives are so fast that measuring application launches, game level loads or boot time simply shows no difference between them all. Instead, by focusing on pure I/O performance I’ve at least been able to show what drives are technically the fastest and then base my recommendation on a good balance of raw performance and price. Then there’s the stuff that’s more difficult to benchmark - long term reliability and consistency of performance. Most of these drives end up in one of my work machines for several months on end. I use that experience in helping formulate my recommendations. In short, I’m still looking to expand the test suite and add meaningful tests - it’s just going to take some time. This is a lengthy process as each new controller poses new challenges from a benchmarking perspective.
The Test
| CPU | Intel Core i7 965 running at 3.2GHz (Turbo & EIST Disabled) |
| Motherboard: | Intel DX58SO (Intel X58) |
| Chipset: | Intel X58 + Marvell SATA 6Gbps PCIe |
| Chipset Drivers: | Intel 9.1.1.1015 + Intel IMSM 8.9 |
| Memory: | Qimonda DDR3-1333 4 x 1GB (7-7-7-20) |
| Video Card: | eVGA GeForce GTX 285 |
| Video Drivers: | NVIDIA ForceWare 190.38 64-bit |
| Desktop Resolution: | 1920 x 1200 |
| OS: | Windows 7 x64 |
Sequential Read/Write Speed
Using the latest build of Iometer I ran a 3 minute long 2MB sequential write test over the entire span of the drive. The results reported are in average MB/s over the entire test length:
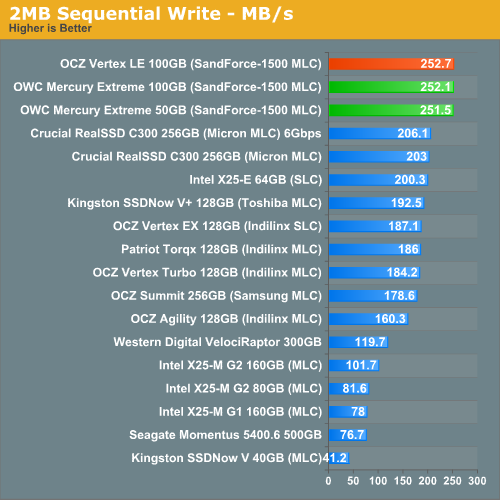
Sequential write speed is completely unaffected by the drop in capacity. The 50GB $229 OWC Mercury Extreme performs just as well as the 100GB version from OWC or OCZ. The three also happen to be the fastest SSDs I've tested at this point in terms of sequential write speed.
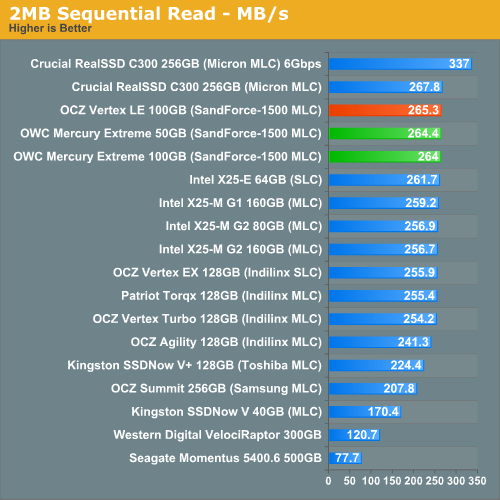
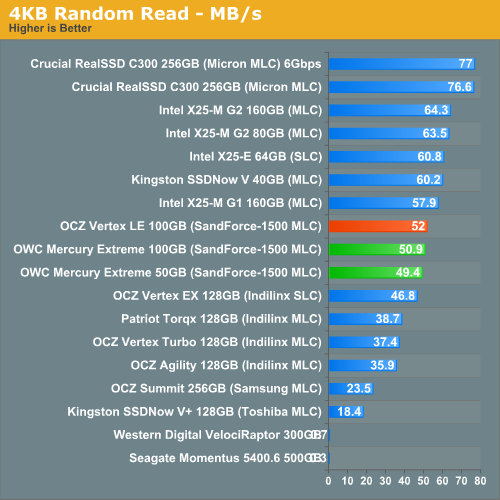
Sequential read speed is also unaffected. There's absolutely no drop in performance here when you go to the smaller capacity. This is why OWC states that the 50GB drive performs just as well as the 100GB and 200GB drives. The next page will show you why that's a false statement.
Random Read/Write Speed
This test writes 4KB in a completely random pattern over an 8GB space of the drive to simulate the sort of random writes that you'd see on an OS drive (even this is more stressful than a normal desktop user would see). I perform three concurrent IOs and run the test for 3 minutes. The results reported are in average MB/s over the entire time.
I've had to run this test two different ways thanks to the way the newer controllers handle write alignment. Without a manually aligned partition, Windows XP executes writes on sector aligned boundaries while most modern OSes write with 4K alignment. Some controllers take this into account when mapping LBAs to page addresses, which generates additional overhead but makes for relatively similar performance regardless of OS/partition alignment. Other controllers skip the management overhead and just perform worse under Windows XP without partition alignment as file system writes are not automatically aligned with the SSD's internal pages.
First up is my traditional 4KB random write test, each write here is aligned to 512-byte sectors, similar to how Windows XP might write data to a drive:
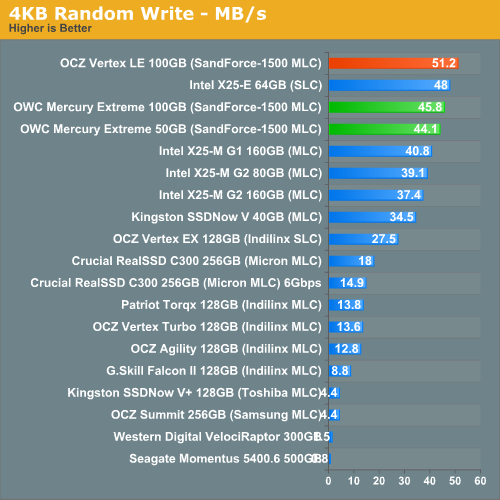
Unaligned 4KB random writes are a bit lower, but nothing tremendous. For some reason both of the OWC Mercury drives actually performed lower than our Vertex LE sample in this test. These should all be the same drive. As we saw in the last review however, in order to better represent performance under modern OSes we need to look at 4K aligned writes since that's what ends up happening most of the time.
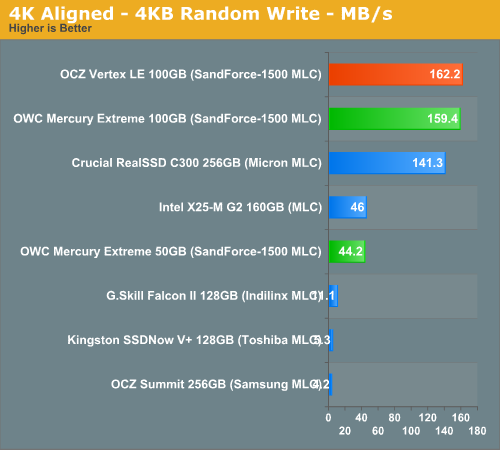
Peak random write performance isn't nearly as good on the 50GB drive. While the 100GB SF-1500 based drives can muster around 160MB/s, the 50GB drive can only manage 44.2MB/s. It's not a deal breaker by any means, and shouldn't really be noticeable in real world usage - but this is the downside to the 50GB drive. Note that at 44.2MB/s, it's still roughly the same speed as Intel's X25-M G2.
Overall System Performance using PCMark Vantage
Next up is PCMark Vantage, another system-wide performance suite. For those of you who aren’t familiar with PCMark Vantage, it ends up being the most real-world-like hard drive test I can come up with. It runs things like application launches, file searches, web browsing, contacts searching, video playback, photo editing and other completely mundane but real-world tasks. I’ve described the benchmark in great detail before but if you’d like to read up on what it does in particular, take a look at Futuremark’s whitepaper on the benchmark; it’s not perfect, but it’s good enough to be a member of a comprehensive storage benchmark suite. Any performance impacts here would most likely be reflected in the real world.
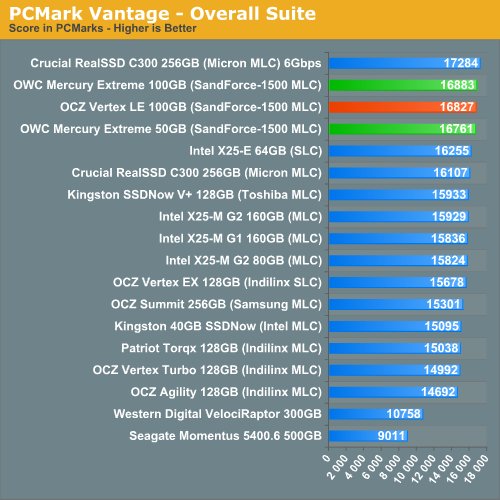
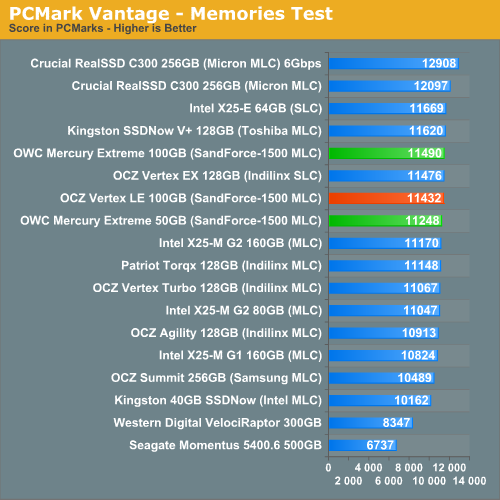
PCMark Vantage mostly echoes what you'd expect based on our data thus far. There's no real performance difference, in the real world, between the 100GB and 50GB SandForce SF-1500 MLC drives. It's only in the HDD specific test that we see any evidence of a slower drive, and even then the drop isn't that great.
The memories suite includes a test involving importing pictures into Windows Photo Gallery and editing them, a fairly benign task that easily falls into the category of being very influenced by disk performance.
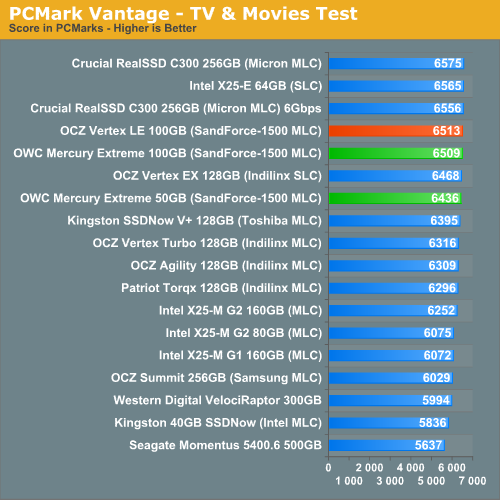
The TV and Movies tests focus on on video transcoding which is mostly CPU bound, but one of the tests involves Windows Media Center which tends to be disk bound.
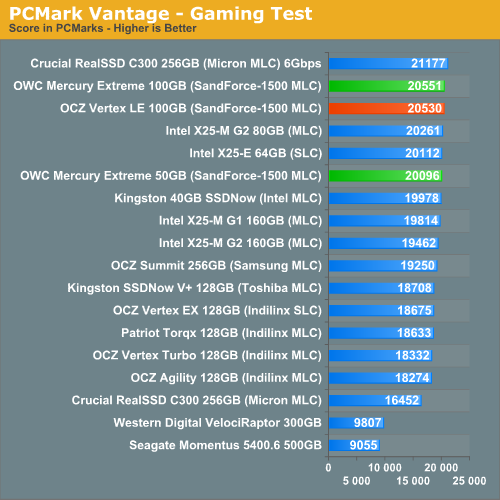
The gaming tests are very well suited to SSDs since they spend a good portion of their time focusing on reading textures and loading level data. All of the SSDs dominate here, but as you'll see later on in my gaming tests the benefits of an SSD really vary depending on the game. Take these results as a best case scenario of what can happen, not the norm.
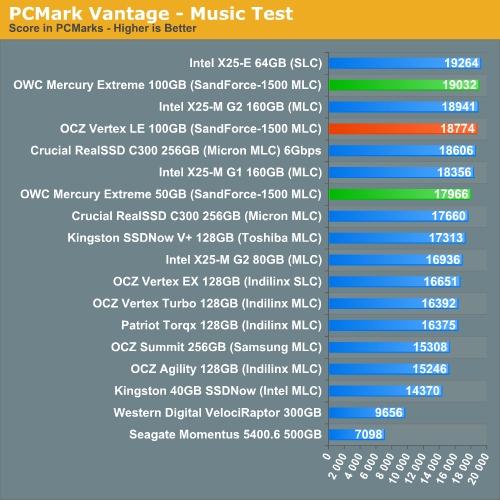
In the Music suite the main test is a multitasking scenario: the test simulates surfing the web in IE7, transcoding an audio file and adding music to Windows Media Player (the most disk intensive portion of the test).
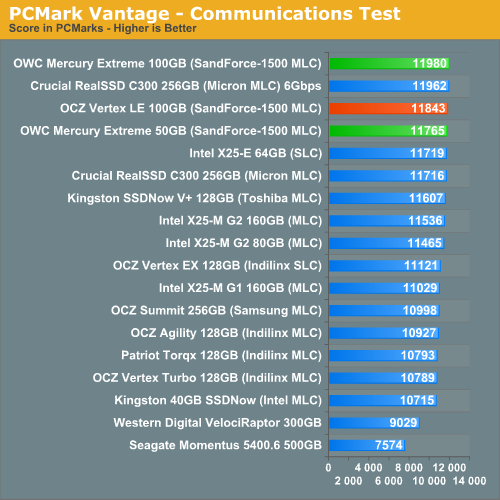
The Communications suite is made up of two tests, both involving light multitasking. The first test simulates data encryption/decryption while running message rules in Windows Mail. The second test simulates web surfing (including opening/closing tabs) in IE7, data decryption and running Windows Defender.
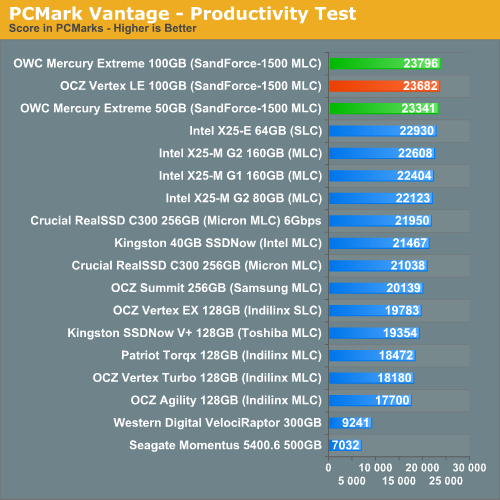
I love PCMark's Productivity test; in this test there are four tasks going on at once, searching through Windows contacts, searching through Windows Mail, browsing multiple webpages in IE7 and loading applications. This is as real world of a scenario as you get and it happens to be representative of one of the most frustrating HDD usage models - trying to do multiple things at once. There's nothing more annoying than trying to launch a simple application while you're doing other things in the background and have the load take forever.
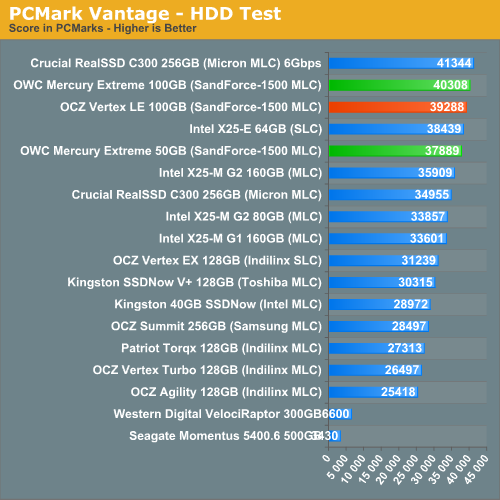
The final PCMark Vantage suite is HDD specific and this is where you'll see the biggest differences between the drives:
AnandTech Storage Bench
Note that our 6Gbps controller driver isn't supported by our custom storage bench here, so the C300 results are only offered in 3Gbps mode.
The first in our benchmark suite is a light usage case. The Windows 7 system is loaded with Firefox, Office 2007 and Adobe Reader among other applications. With Firefox we browse web pages like Facebook, AnandTech, Digg and other sites. Outlook is also running and we use it to check emails, create and send a message with a PDF attachment. Adobe Reader is used to view some PDFs. Excel 2007 is used to create a spreadsheet, graphs and save the document. The same goes for Word 2007. We open and step through a presentation in PowerPoint 2007 received as an email attachment before saving it to the desktop. Finally we watch a bit of a Firefly episode in Windows Media Player 11.
There’s some level of multitasking going on here but it’s not unreasonable by any means. Generally the application tasks proceed linearly, with the exception of things like web browsing which may happen in between one of the other tasks.
The recording is played back on all of our drives here today. Remember that we’re isolating disk performance, all we’re doing is playing back every single disk access that happened in that ~5 minute period of usage. The light workload is composed of 37,501 reads and 20,268 writes. Over 30% of the IOs are 4KB, 11% are 16KB, 22% are 32KB and approximately 13% are 64KB in size. Less than 30% of the operations are absolutely sequential in nature. Average queue depth is 6.09 IOs.
The performance results are reported in average I/O Operations per Second (IOPS):
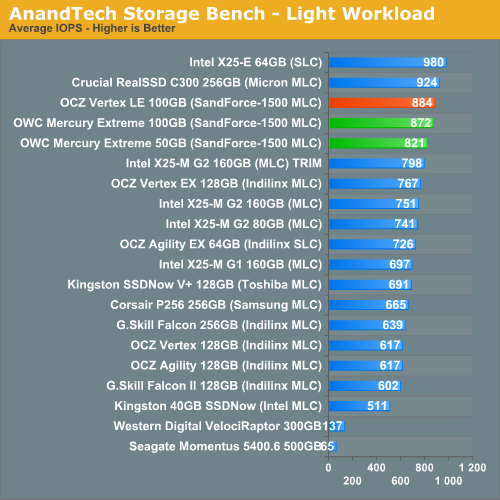
In our light workload we see a small performance drop from the 100GB to 50GB capacity point. It's nothing tremendous though and definitely not noticeable in real world usage. Other than the usual performance degradation issues you see with running an SSD close to max capacity, you shouldn't really see any difference in performance between a 50GB or a 100GB SandForce drive.
If there’s a light usage case there’s bound to be a heavy one. In this test we have Microsoft Security Essentials running in the background with real time virus scanning enabled. We also perform a quick scan in the middle of the test. Firefox, Outlook, Excel, Word and Powerpoint are all used the same as they were in the light test. We add Photoshop CS4 to the mix, opening a bunch of 12MP images, editing them, then saving them as highly compressed JPGs for web publishing. Windows 7’s picture viewer is used to view a bunch of pictures on the hard drive. We use 7-zip to create and extract .7z archives. Downloading is also prominently featured in our heavy test; we download large files from the Internet during portions of the benchmark, as well as use uTorrent to grab a couple of torrents. Some of the applications in use are installed during the benchmark, Windows updates are also installed. Towards the end of the test we launch World of Warcraft, play for a few minutes, then delete the folder. This test also takes into account all of the disk accesses that happen while the OS is booting.
The benchmark is 22 minutes long and it consists of 128,895 read operations and 72,411 write operations. Roughly 44% of all IOs were sequential. Approximately 30% of all accesses were 4KB in size, 12% were 16KB in size, 14% were 32KB and 20% were 64KB. Average queue depth was 3.59.
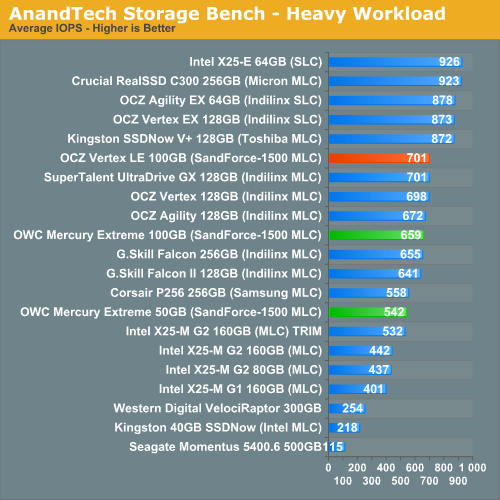
Crank up the IOPS and our 50GB drive stops doing so well. I should point out that despite its fall from grace, the 50GB OWC drive is still as fast as the 160GB Intel X25-M G2. While there's indeed a drop in random write speed, it doesn't appear to be a crippling drop.
Our final test focuses on actual gameplay in four 3D games: World of Warcraft, Batman: Arkham Asylum, FarCry 2 and Risen, in that order. The games are launched and played, altogether for a total of just under 30 minutes. The benchmark measures game load time, level load time, disk accesses from save games and normal data streaming during gameplay.
The gaming workload is made up of 75,206 read operations and only 4,592 write operations. Only 20% of the accesses are 4KB in size, nearly 40% are 64KB and 20% are 32KB. A whopping 69% of the IOs are sequential, meaning this is predominantly a sequential read benchmark. The average queue depth is 7.76 IOs.
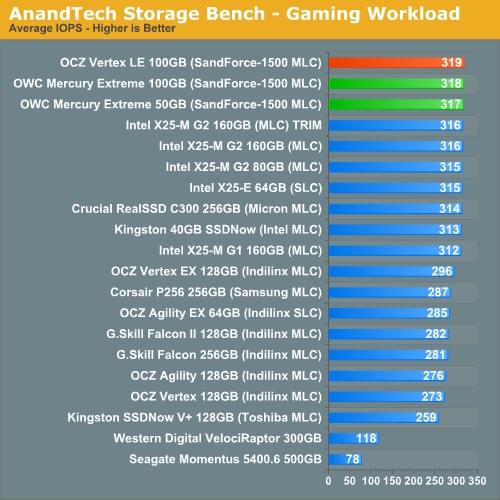
We've already shown that read speeds are no lower with the 50GB drive, and thus our gaming workload which involves mostly texture/level loads off of the SSD shows no difference between the various capacity points of SandForce drives. We're still very bottlenecked by 3Gbps SATA here.
Final Words
Update: Since the publication of this review OWC appears to have switched controllers for the Mercury Extreme SSD. The current specs look similar to that of SandForce's SF-1200 controller, not the SF-1500 used in the earlier drives. Performance and long term reliability (in an enterprise environment) are both impacted. For more information, read this.
With half the capacity of the 100GB Vertex LE we looked at last week, OWC's 50GB Mercury Extreme shows that while there is a performance drop with SandForce's SF-1500 50GB platform it is limited strictly to small file random write speed. Even with the performance drop, the drive is no slower than Intel's X25-M G2. And in sequential write performance it's still significantly faster.
As I mentioned in my Vertex LE review, the SandForce controller used in this drive is still largely unproven. OWC does offer a 5 year warranty on the drive, so presumably you'll be covered if something should happen to it - I would just recommend backing up regularly.
As a SSD, 50GB is enough for a notebook or a boot/applications drive assuming you don't have too many large applications. With more inherent spare area than any other consumer SSD on the market, the Mercury should be a bit more resillient as it approaches its full capacity. Despite a competitive price tag, this 50GB drive is easily the most expensive small capacity SSD you can buy in its class. Not in terms of overall price, but in terms of cost per GB. Intel's 80GB X25-M will give you around 50% more usable space for roughly the same price. You do get more performance out of the 50GB OWC drive, but with only 50GB of space it's really a tradeoff. If you only run one or two I/O intensive applications, then the 50GB drive may be best suited for you. If you run more than just a couple of apps, you may be better off with the Intel X25-M.
I am still unsure about the long term reliability of these drives based on SandForce's controller. It will take several months for me to get to a comfortable point with them. If you're fine with being an early adopter here, by all means go for it. If the capacity doesn't turn you off, the performance at first glance looks quite good.


